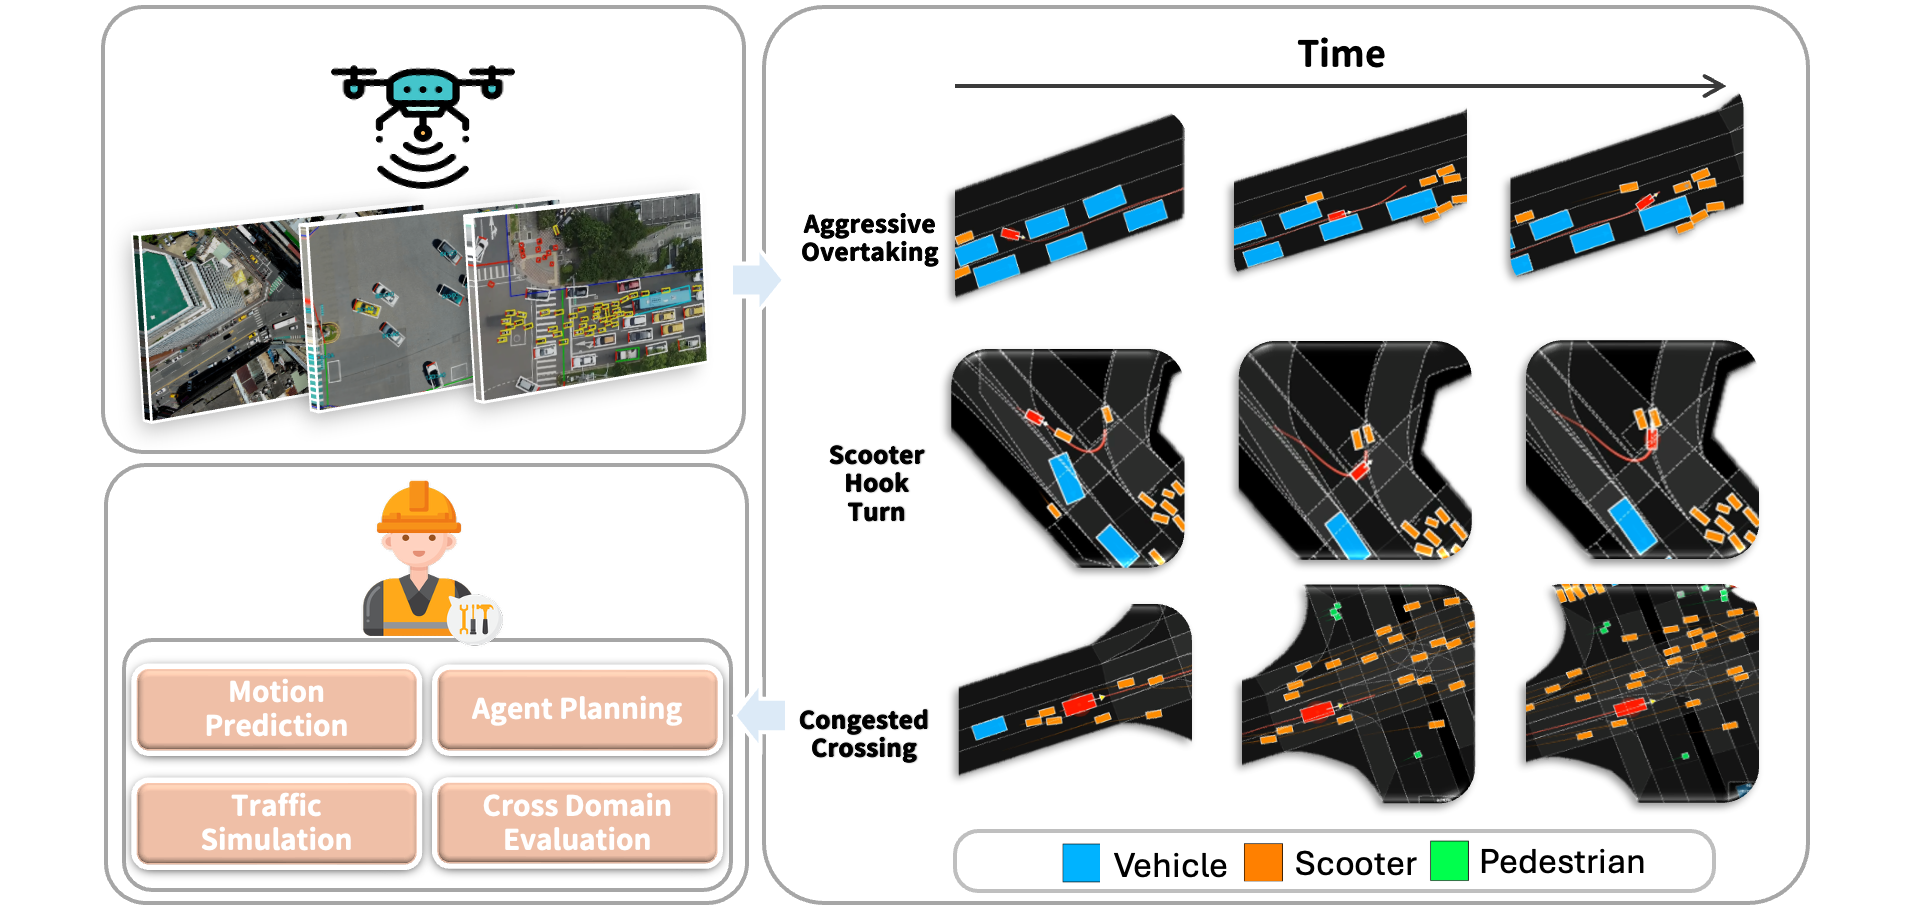
Commercial use: The HetroD dataset is free for non-commercial use only. If you are interested in commercial use, please visit https://levelxdata.com.
Acknowledgment: The HetroD dataset was processed by leveLXData, and leveLXData's processing pipeline was utilized.
Note on scale: We report the dataset size as over/roughly 65.4k trajectories because counts may change slightly during ongoing quality control.
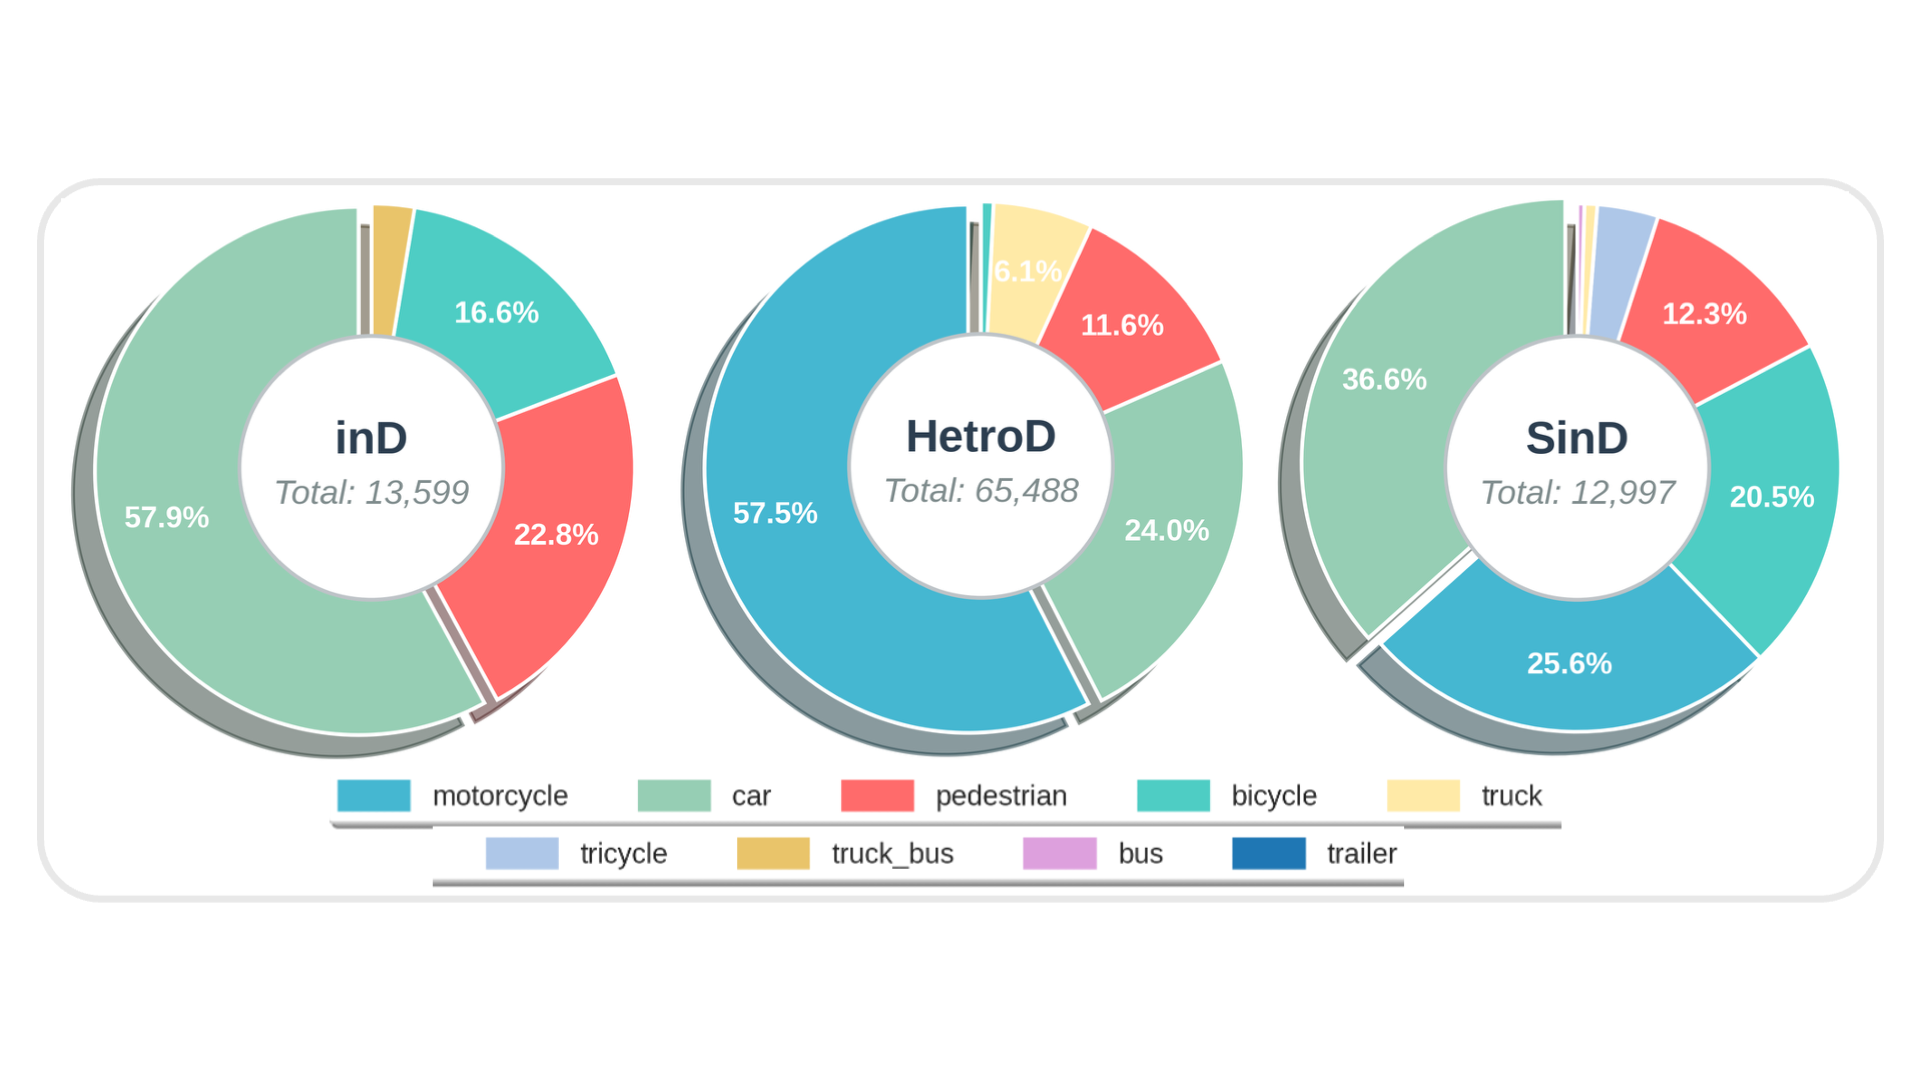
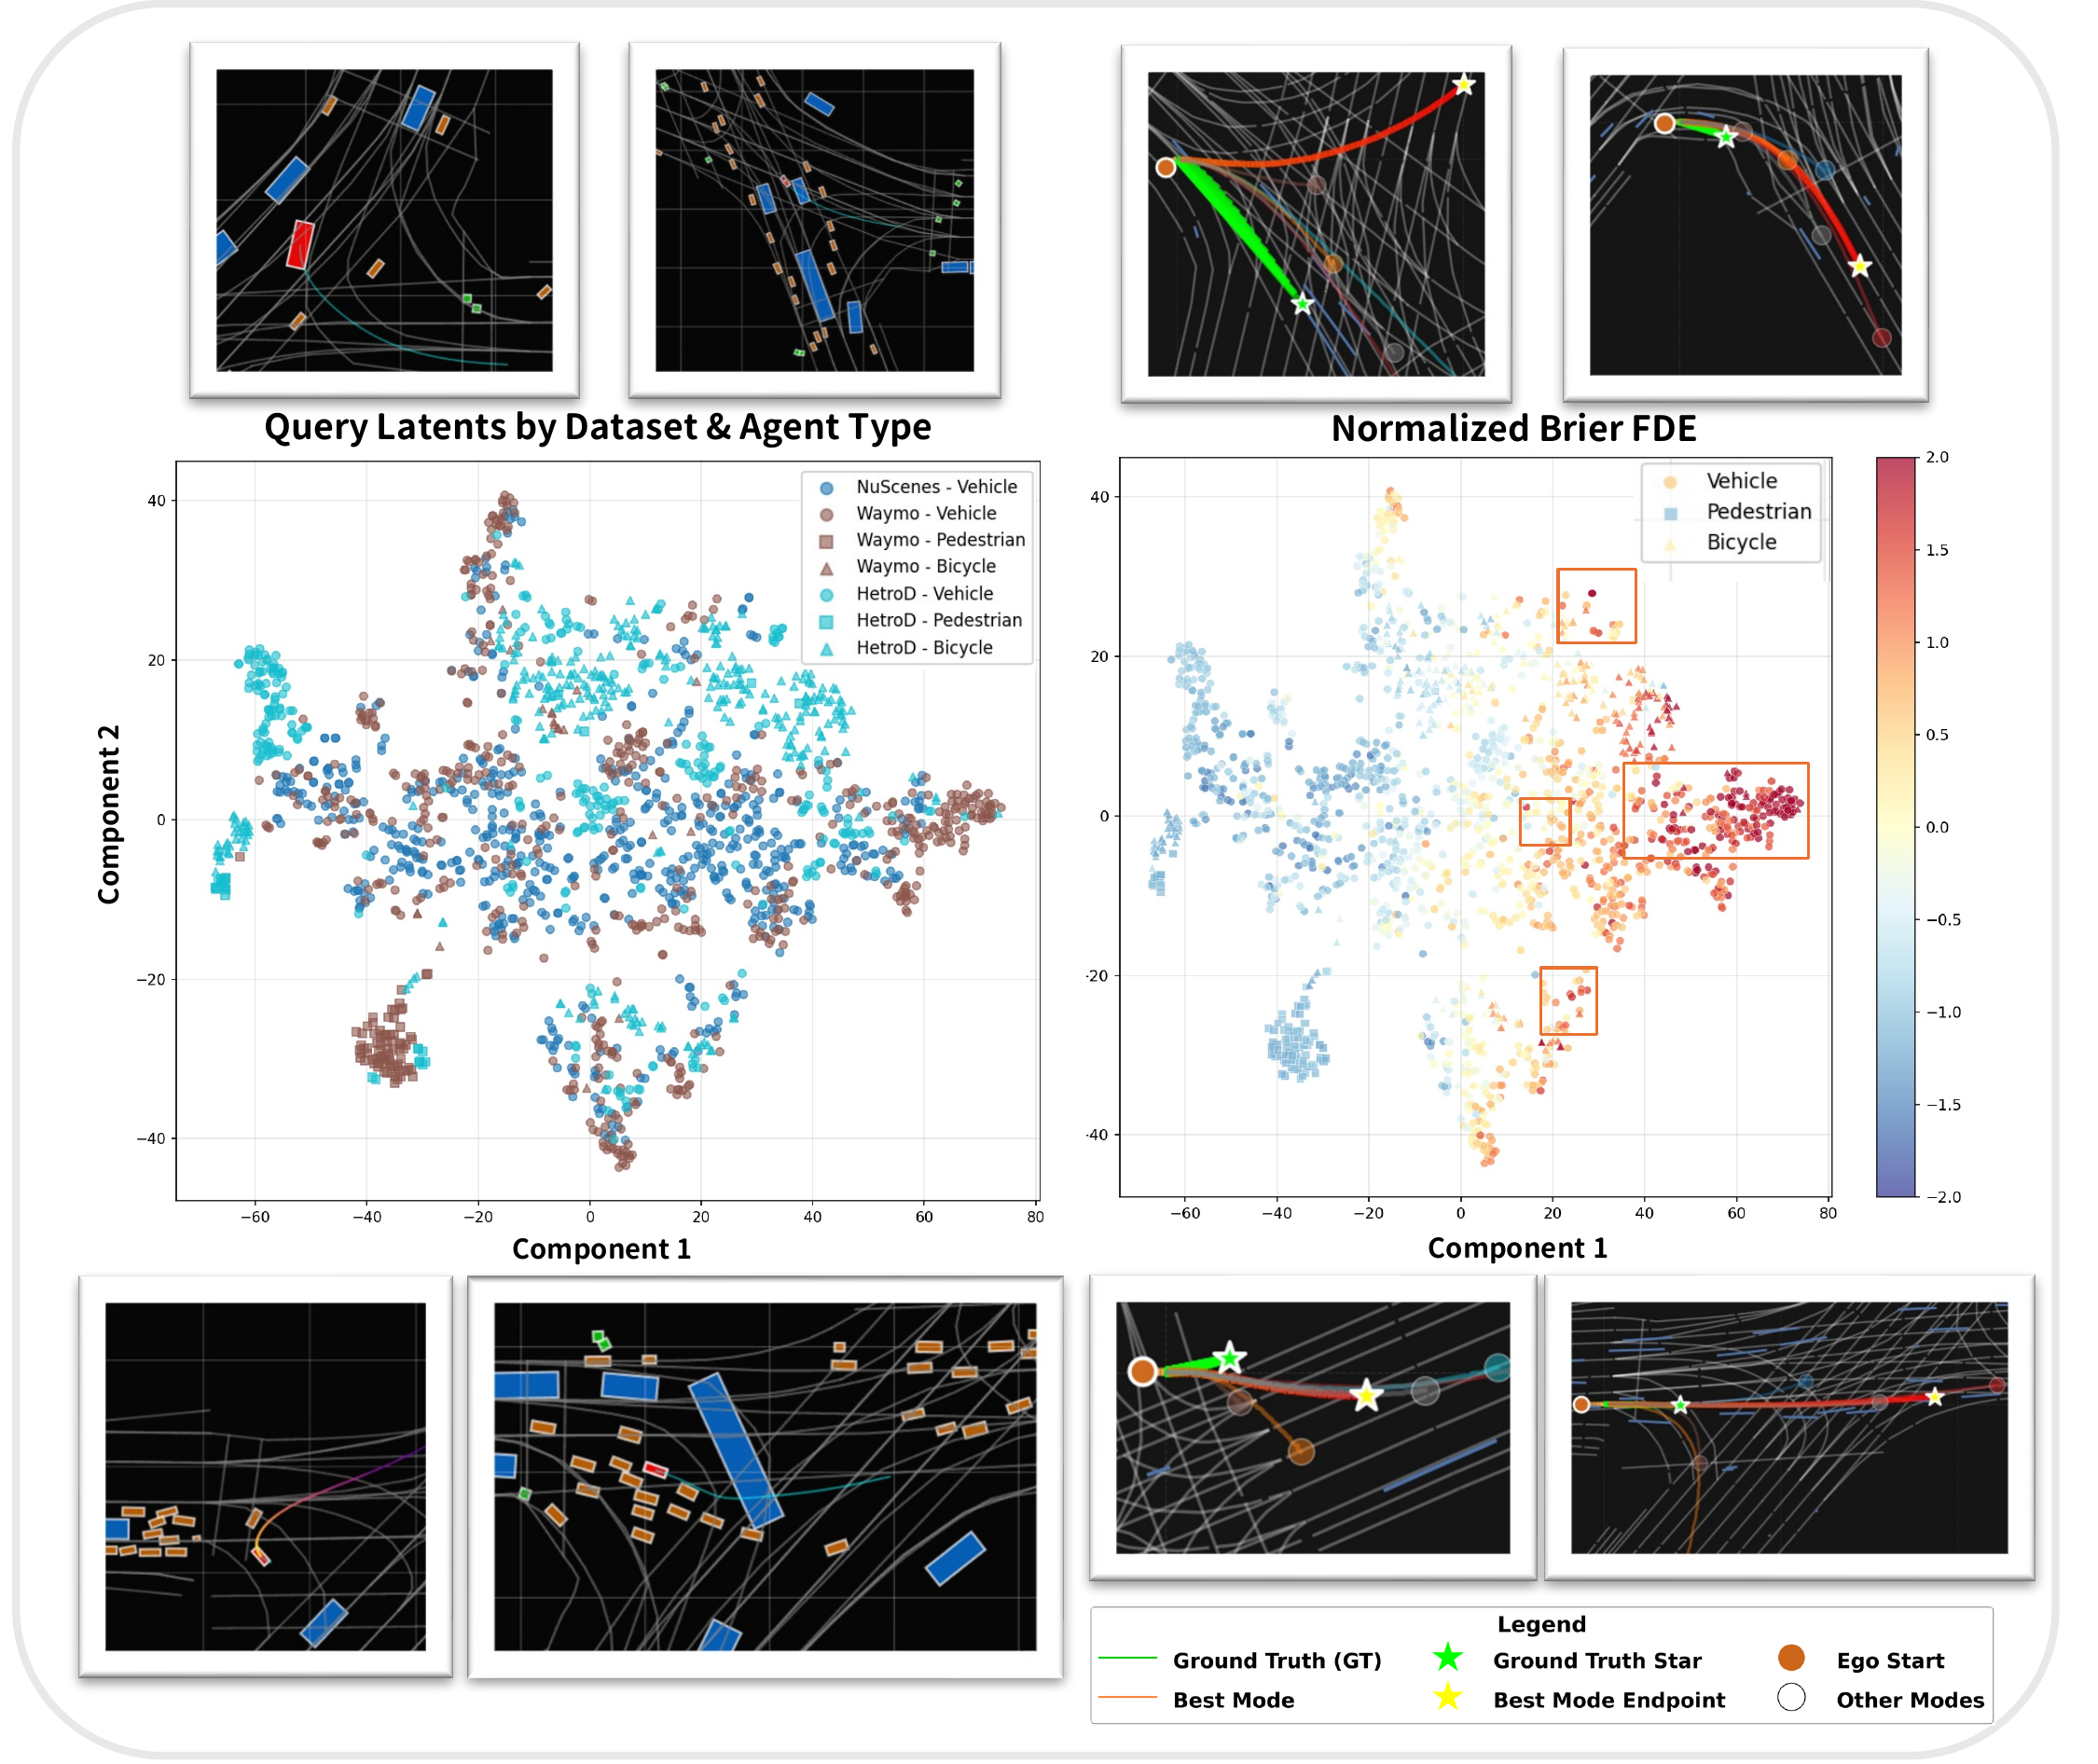
We present HetroD, a dataset and benchmark for developing autonomous driving systems in heterogeneous environments. HetroD targets the critical challenge of navigating real-world heterogeneous traffic dominated by vulnerable road users (VRUs), including pedestrians, cyclists, motorcyclists, and vehicles. These mixed agent types exhibit complex behaviors such as hook turns, lane splitting, and informal right-of-way negotiation. Such behaviors pose significant challenges for autonomous vehicles but remain underrepresented in existing datasets focused on structured, lane-disciplined traffic. To bridge the gap, we collect a large-scale drone-based dataset to provide a holistic observations of traffic scenes with centimeter-accurate annotations, HD maps, and traffic signal states. We further develop a modular toolkit for extracting per-agent scenarios to support downstream task development. In total, the dataset comprises over 65.4k high-fidelity agent trajectories, 70% of which are from VRUs. HetroD supports modeling of VRU behaviors in dense, heterogeneous traffic and provides standardized benchmarks for forecasting, planning, and simulation tasks. Evaluation results reveal that state- of-the-art prediction and planning models struggle with the challenges presented by our dataset: they fail to predict lateral VRU movements, cannot handle unstructured maneuvers, and exhibit limited performance in dense and multi-agent scenarios, highlighting the need for more robust approaches to heterogeneous traffic.
| Dataset | Platform | Tracks | Duration | Interaction Scale1 | Heterogeneous Interaction Scale2 | Geographical Density3 | VRUs (%)4 |
|---|---|---|---|---|---|---|---|
| NuScenes [1] | On-board | ∼90k† | 320h | 0.675 | 0.549 | — | 20.1% |
| Waymo [2] | On-board | 7.6M | 574h | 1.000 | 1.000 | — | 11.5% |
| Argoverse2 [3] | On-board | 13.9M | 763h | 0.632 | 0.318 | — | 10.0% |
| NuPlan [4] | On-board | ∼5M† | 1282h | 0.274 | 0.213 | — | 46.3% |
| INTERACTION [5] | Drone | 40k | 16.5h | 0.132 | — | 0.011 | — |
| inD [6] | Drone | 13.5k | 10h | 0.071 | 0.185 | 0.023 | 39.4% |
| SinD [7] | Drone | 13.2k | 7.02h | 0.099 | 0.324 | 0.016 | 62.1% |
| HetroD | Drone | ~65.4k | 17.5h | 0.223 | 0.889 | 0.026 | 69.9% |
Notes:
† Estimated values based on official statistics.
— Metric not available.
1 Sinter = Σscenarios Dinter.
2 Shet = Σscenarios Σi,j 1(TTCi,j < 2 s ∧ typei ≠ typej).
3 Dgeo = N/A, where N is the number of agents within an 8 s window and A is the corresponding area.
4 VRUs = 100 × NVRU/(NVRU + NVeh) (VRU: pedestrians, bicycles/cyclists, motorcycles, tricycles; Vehicles: cars, trucks, buses, vans)
Motion prediction models struggle due to heterogeneous traffic complexity.
| Train \ Test | NuScenes | Waymo* | SinD | HetroD |
|---|---|---|---|---|
| NuScenes | 2.95 | 10.43 | 5.14 | 6.76 |
| Waymo | 4.01 | 2.28 | 4.26 | 6.71 |
| SinD | 16.07 | 26.34 | 2.06 | 3.30 |
| HetroD | 21.39 | 26.49 | 3.71 | 0.44 |
| Train \ Test | NuScenes | Waymo* | SinD | HetroD |
|---|---|---|---|---|
| NuScenes | 2.99 | 8.79 | 5.23 | 9.37 |
| Waymo | 2.67 | 2.20 | 3.53 | 10.75 |
| SinD | 8.23 | 13.40 | 1.96 | 9.23 |
| HetroD | 19.57 | 25.28 | 8.06 | 0.75 |
*Waymo uses 30% of its original training data due to resource constraints.
| Setting | MTR | Wayformer |
|---|---|---|
| Same-map | 0.44 | 0.75 |
| Diff-map | 1.17 (+166%) | 1.53 (+104%) |
| Diff-time | 0.42 (−5%) | 0.76 (+1%) |
| Scenario | MTR-Waymo* | MTR-SinD | MTR-HetroD |
|---|---|---|---|
| Agent type | |||
| Vehicle | 3.64 | 2.55 | 0.83 |
| Two-wheeler | 8.69 | 4.63 | 1.16 |
| Pedestrian | 2.85 | 1.17 | 0.26 |
| Cross-type TTC risk | |||
| High risk (TTC < 2 s) | 8.51 | 4.76 | 1.25 |
| Moderate (2 ≤ min TTC < 4 s) | 8.48 | 4.67 | 1.19 |
| Low (TTC > 4 s) | 7.87 | 4.00 | 0.90 |
| Scene-level heterogeneity | |||
| Low heterogeneity density | 5.01 | 3.08 | 0.90 |
| High heterogeneity density | 8.04 | 4.25 | 1.06 |
Distribution: Vehicles 39.4%, Two-wheelers 51.5%, Pedestrians 9.1% | TTC: High 26.5%, Moderate 8.7%, Low 64.8% | Heterogeneity: Low 66.3%, High 33.7%
SOTA Rule-based planners show increased collision rates in heterogeneous traffic scenarios.
| Dataset | Planner | NuPlan Score ↑ | TTC Bound ↑ | Progress ↑ | Lane Score ↑ | Comfort ↑ | Collisions ↓ |
|---|---|---|---|---|---|---|---|
| NuPlan | IDM | 0.85 | 0.94 | 0.92 | 0.99 | 0.48 | 0.016 |
| PDM-Closed | 0.83 | 0.97 | 0.91 | 0.99 | 0.31 | 0.006 | |
| HetroD | IDM | 0.68 | 0.91 | 0.81 | 0.89 | 0.37 | 0.074 |
| PDM-Closed | 0.70 | 0.95 | 0.78 | 0.97 | 0.21 | 0.040 |
| Planner | At-Fault Collision Rate | VRU Front Collision Rate | VRU Lateral Collision Rate |
|---|---|---|---|
| IDM | 0.074 | 0.008 | 0.031 |
| PDM-Closed | 0.040 | 0.004 | 0.022 |
Latent scenario embeddings from Wayformer trained on Waymo, revealing distinct clustering and prediction challenges across datasets
@inproceedings{hetrod,
title={HetroD: A High-Fidelity Drone Dataset and Benchmark for Autonomous Driving in Heterogeneous Traffic},
author={Yu-Hsiang Chen and Wei-Jer Chang and Christian Kotulla and Thomas Keutgens and Steffen Runde and Tobias Moers and Christoph Klas and Wei Zhan and Masayoshi Tomizuka and Yi-Ting Chen},
booktitle={Proceedings of the IEEE International Conference on Robotics and Automation (ICRA) },
year={2026}
}